|
|
Post by tachyon on Dec 12, 2019 14:11:12 GMT
I know why EFL Stats present xG as a table, it’s to breed familiarity & make it accessible. But it simply replaces one unique set of outcomes (the actual results) with another unique set based on xG. xDraws are assigned if the XG differential lies between a narrow xG band & xWins or xLosses are decided when the match expected goals differential lies outside these bounds. Average points and average final positions also trade brevity for loss of insight. The aim of xG is to illustrate the uncertainty & randomness that exists is a low scoring sport, such as soccer. You can do that by simulation every game played so far using each individual xG chance that was created, repeating 10,000 times and plotting the range of current league positions played out in those simualtions. For Stoke it is the most wide ranging in the division. We’re as likely to be 2nd as we are to be 19th, but from a performance viewpoint, there are 16 teams who are more likely to be in the bottom 3 than us, given the chance creation performance of all 24 teams to week 21. Overall, we’re currently most likely to be in the “not going up, not going down” group of 15 Attachment Deleted |
|
|
|
Post by tachyon on Dec 11, 2019 9:23:58 GMT
The biggest value expected goals or xG brings to the table is in analysing longer term trends. If you're continually creating more chances than the opposition, even if you're not always converting those chances, it's very likely that over time your outcomes (results) will adhere more closely to your process (xG differential). After six games Stoke had one whole point from a possible 18 (results dire), but a fairly equal share of the xG (process not great, but not terrible) in their matches to go with a similar trend from the previous season. At that season low in September, Infogol simulated the remainder of the season using the xG ratings of all 24 teams to see when it would be more likely than not that Stoke would claw their way out of the bottom three and posted it on Twitter. Attachment DeletedWe estimated Stoke would start to be slightly more likely than not to escape from the drop zone by game week 22. That's next week and with favourable results we could hit the scheduled recovery at the earliest predicted time.....or we could take until week 30 or we might not manage it at all. That's what projections are, they come with an uncertainty, grouped around the most likely outcome. XG from the start of September has done a pretty good job of projecting where Stoke would be half way through December and currently it thinks our median final points total will be 54, our final median finishing position will be 18th and we currently have a 21% chance of relegation. |
|
|
|
Post by tachyon on Nov 29, 2019 10:50:02 GMT
Each Championship season is unique and each team has its own unique survival target (mainly because they aren't competiting against themselves).
If you run simualtions of the remaining games, that survival target is the points won by the 22nd team or the 21st if you yourself are in the bottom three for that simulation.
Currently the median survival points total for Stoke is 49 points. If you want to extend that to goal difference as well, that figure is -17.
Our current median points forecast is 55 points and a goal difference of -8, so we do have our heads above the water.
These Infogol numbers are pretty much in line with spread quotes from Sporting Index, who project our final total at 54 and the non team specific survival line at 48.
|
|
|
|
Post by tachyon on Nov 24, 2019 9:24:31 GMT
Based on where we currently are & our rolling xG, simulations of the remainder of the season see us automatically promoted once every 1,000 years. We make the playoffs, on average once every 50 years. We get relegated once every eight years. Our median final points total is now 57 points. Here's the range around that average.  |
|
|
|
Post by tachyon on Nov 23, 2019 13:23:46 GMT
[/quote]Interesting , thanks! What does “Both teams to score -no” mean? I understand the first part, but why “no”?[/quote] That's from the app, correct? It means we think there is value in either Stoke or Wigan or both not to score on Saturday. Attachment DeletedIn terms of match result, we think a Stoke win is most likely, but aren't as confident as the bookmakers. |
|
|
|
Post by tachyon on Nov 23, 2019 9:25:51 GMT
|
|
|
|
Post by tachyon on Nov 23, 2019 9:01:26 GMT
People won’t like to hear it, but the best indicator teams have stats wise for predictions/regression/overperformance/underperformance is xG. That’s not to say it’s perfect or infallible or without exceptions but there’s a reason is used by bookies, scouts, mangers and sporting directors all over the planet. Bookies win all the time because they use “expected value” or outcomes to set their odds and xG is just in that model. Nathan overplayed his hand talking about it though. Do you have a link to a handy xG table for the championship? Here's the xG created and allowed per game so far from Infogol. Includes last night's game and penalties. It's arranged in the most likely table order based on the xG differential. Blue is good, red isn't.  |
|
|
|
Post by tachyon on Nov 13, 2019 7:43:21 GMT
[/quote] Really great, interesting post, I very much enjoyed that - you've clearly got a lot of great insight on this stuff. Thanks for taking the time and sharing it!! [/quote] thanks, Tony I came up with the idea of xG independently of a couple of other analysts in 2010. I called the metric "goal expectation". Around 2013 the analytics community had a vote to standardise terminology and xG won. I voted for chance quality. I've worked providing xG models & implimenting them in real life scenarios across a variety of industries since then. I know xG inside out, the pitfalls, the benefits. Inside football I know which teams are using xG, the people making the decisions and the deals that have used xG to inform. No one knows more about xG than I do and I'm happy to share what I can  |
|
|
|
Post by tachyon on Nov 12, 2019 21:11:58 GMT
[/quote] You need a wife , girlfriend or both 😎[/quote] You need to work out how to edit a reply  |
|
|
|
Post by tachyon on Nov 12, 2019 9:15:28 GMT
[/quote] Im a strong believer in randomness, even very sadly once doing a Monte Carlo sum of league position based on giving every team the same probability-distribution of scoring rates and seeing what the final range was. (There was probably a more elegant way, but i wanted to tweak the parameters). I can't remember the details but sort of remember about an average 30pt gap from top to bottom. So that's the randomness component of the range of final pts in the table. 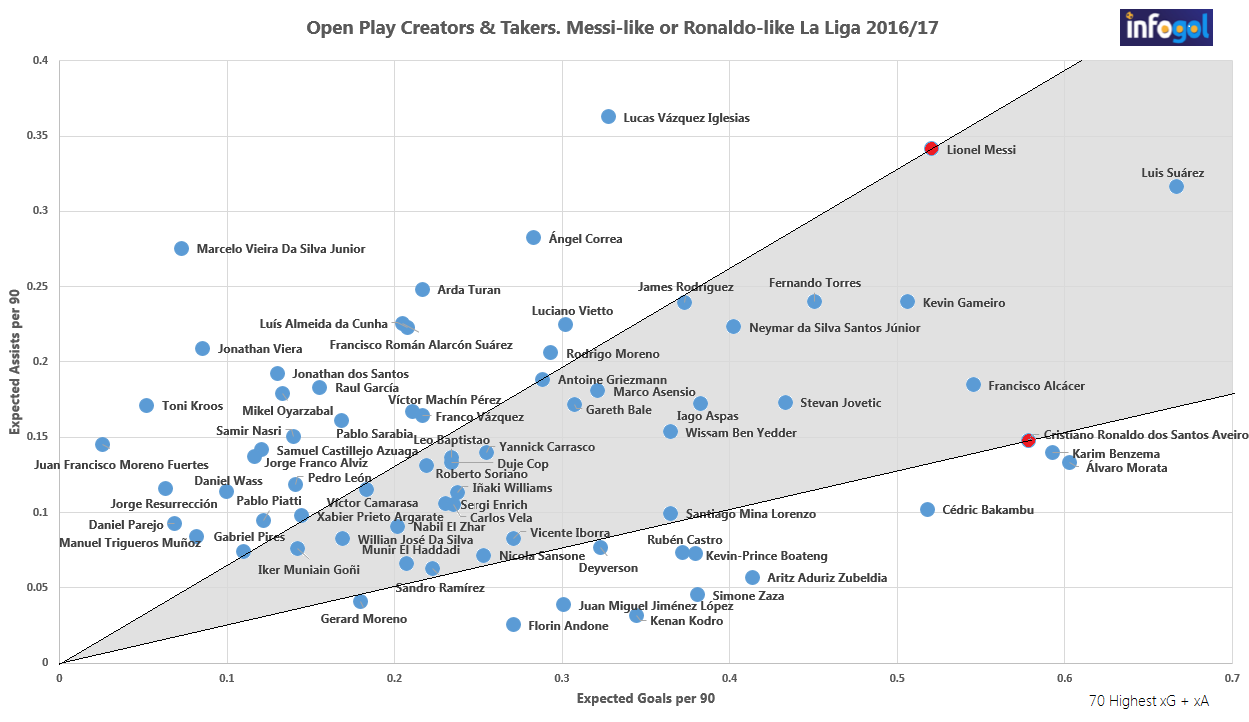 [/quote] That's a good method. The standard deviation of final points for an "all teams equal" Championship is 9 points, the reality is around 15. For the 20 team Premier League the numbers are 8 & 16 respectively. As to the "clinical vs not clinical", the data persuades me. If you took the 20 most under achieving goal scoring teams (they scored proportionally fewest goals compared to the xG they created) in their first 23 Championship games and then looked at how they did in the final 23 games, you find that, as a group they performed exactly in line with their combined xG in the second half of the season. The under-performance regressed almost completely to their actual xG. Same thing happens with the biggest over performers. The over performance dwindles away and their actual returns match their underlying process in the remainder of the season. Also if you try to predict the second half performance from the first half, using past xG beats using past actual goals in nearly 80% of the cases. Being clinical is largely a myth, as is being Dave Bamber (the latter is cognitive bias anchored on a few high profile memories). Defensively, it's a little more complicated, teams like Burnley do seem to retain a bit of their over performance, but it's not much & opponents adapt & even Dyche can't keep teams above the curve for long. The underlying quality of teams and players to score goals is defined predominately by their ability to create or get onto the end of chances, and not how they convert those chances, as defined by their actual record. That is mostly random noise. The talent to convert chances has a very narrow range, it is very difficult to find differences in finishing ability that precludes the possibility that the regression coefficient isn't zero. The first time I looked at this problem I only found one PL player (Bale and possibly Agero at that stage of his career) whose finishing ability could reasonably be said to be better than the league average and that dwindled once I took out his free kicks. Similarly, Goal keeping xG efficiency, based on how likely they are to save a shot based on the post shot characteristics (shot type, placement, power, deflection etc) bounces around horribly. I use them as descriptive of performance (for "Team of the Week" stuff), but find very little repeatable signal in over or under performance. Bottom line, Stoke are a mid table side. That's where our results are headed, not because we're going to become clinical or opposing keepers more generous to balance Jack's howlers, but because that's where our underlying process has been since Rowett took over and remained so under Jones. If MO'N is to improve Stoke, he'll have to improve the process, either because he's tactically astute or through new signings, the latter agrees with your final "low quality" players point. The so called "new manager bounce" is often nothing more than a side who have been under performing their underlying stats, then regressing towards their process after the old boss has been fired. The new man often changes little, but reaps the reward of this regression. We don't have extensive xG for internationals, (we have to make do with actual goals), but MO'N certainly improved NI as a defensive unit and mildly improved the attacking output. But it was virtually impossible not to improve the defensive numbers, they were so bad when he took over (see below) Attachment DeletedWhen he took over NI they were shipping nearly 3 goals per game & scoring 0.5 gpg. He's turned that around to a side that scores and concedes around 1.2 gpg. So he's got a different problem to solve at Stoke because that's the point we are already at. I'll be looking for the xG created & xG allowed to start getting some decent separation, rather than a not unexpected win at the worst team in the Championship, (laced with a bit of good fortune). I love the La Liga graphic. The best players do have the best xG & xA (expected assists) per 90 figures, but that is partly team driven. Messi & Ronaldo played for the two best sides, so they had high quality teammates. The idea behind the plot was as a scouting device to find Messi like or Ronaldo like players among the less Spanish teams by drawing a line through their data point to the origin and seeing which players were close to each line. There's nothing implied about their ability to over or under perform xG. You do know the graphic is from my Twitter feed? :-) Good points raised, we're always trying to make xG accessible and intelligent, thoughtful contributions like this help immensely. It's very difficult to interact with the "xG is rubbish" brigade and non evidential nonsense pioneered by the likes of Jeff Stelling. cheers! |
|
|
|
Post by tachyon on Nov 11, 2019 10:52:14 GMT
Its not luck we are at the bottom though. Luck's a bad choice of words, but that's down to us and variance is even worse. xG's even worse again, but the audience wasn't particularly broad when it was coined. Single game xG is mostly descriptive, it does quantify talking points/misses/goals, but it doesn't carry much signal. xG's most useful when looked at in the longer term and it easily outperforms actual goals allowed or scored as an indicator of a team's underlying ability and how they'll do in the future. The debate is largely over on that topic. Team's who are under or over performing their xG aren't "poor" or "clinical" they are almost always experiencing the randomness that is inherent in any probabilistic process and outcome invariably regresses to process. I had Gregory's header as a 40% chance, 80% is slightly above penalty kick territory. |
|
|
|
Post by tachyon on Nov 11, 2019 10:17:26 GMT
Happy to just survive TBH.. BTW not wishing to dismiss any optimism.. I am sure someone like tachyon will tell us the exact odds if we asked him/her nicely We've got Barnsley around 80% for the drop (remember, that's who we beat on Saturday). Then Luton at around 45%. Then a gaggle of clubs at around 30+% starting with us. To put it in context, we're a legitmate mid table team who are currently 11 points from mid table and three points below 21st. Results went our way on Saturday, but we're still around 36% for the drop. So more likley we stay up than go down. |
|
|
|
Post by tachyon on Nov 11, 2019 9:47:39 GMT
Probably worth mentioning that a great deal of the success enjoyed by the Sounders is down to a former blogger who took a fair bit of interest in that xG nonsense.
And a great deal of the success enjoyed by Toronto (who Seattle beat in the Championship game) is down to a former blogger who took a fair bit of interest in that xG nonsense.
|
|
|
|
Post by tachyon on Nov 7, 2019 9:02:02 GMT
Quote "Look, you can forget all of that ‘Expected Goals’ nonsense. We’re exactly where we deserve to be after the standard of football we’ve played.
It’s no good harping on about how many goals we should have scored, how few goals we should have conceded and how many points we should have.
One of the strongest indicators of a bad football team is one which can’t score enough goals from the chances it creates, or keep the opposition from scoring from the chances it creates".
Sides whose outcome (the goals they score or allow) diverges (in a bad way) from their process (the chances they create or allow), as Stoke's currently does, tend towards their previous process, rather than their previous outcome in the future. So it's a pretty poor indicator of a bad football team.
|
|
|
|
Post by tachyon on Oct 30, 2019 10:57:03 GMT
[/quote]
The metric I saw suggested it was 4.85.
[/quote]
4.85 xG gets you 9 or more goals around 4% of the time.
If anyone want's to know how the 4.85 is calculated, feel free to ask because I calculated it :-)
|
|
|
|
Post by tachyon on Oct 30, 2019 10:12:49 GMT
[/quote]Thanks for that it explains a bit more but still seems to suggest that there is a reason why we should stick to Nathan as it would seem his method is working but we can't score the goals our play deserves in most matches. Interesting that Klopp was chosen by this method. I hadn't realised he was in a relegation fight when Liverpool appointed him. Gives us hope yet. [/quote] The biggest disconnect is between xG allowed (1.2/game) & goals allowed (1.8/game). The usual reason for this is individual errors (check) or opponents pinging shots into the top corner from 30 yards. Neither tend to persist. Either your keeper stops making howlers or they're replaced by someone else (check) and the rate you actually concede goals (the outcome) tends towards the quality & quantity of chances you allow (the process). The "we should be 6th" stats based narrative needs placing in context. If you tally up all 10,000 simulated iterations of the league based on the chance quality & quantity created and allowed in every game to date, the likelihood that Stoke & everyone else * could* occupy a particular range of league positions looks like this.  The red is where a side actually is, the blue + % figure is how likely they are to occupy that range of positions. Our most likely position is between 7th & 14th (it's a 43% chance). The bottom line is we're 23rd but we have the process of a side that is most likely to be somewhere between 7th & 14th & that's the basis you should judge our ability to beat the drop. Compare that to Barnsley who are bottom & based on xG deserve to be in that position. That's why xG is useful & partly why Barnsley are a lot shorter price to go down than we are. Bottom line. Football is a low scoring sport where randomness has a very big effect, especially where there's lots of teams of similar underlying quality. |
|
|
|
Post by tachyon on Oct 29, 2019 19:12:32 GMT
Was talking about this at work the other day, I simply don't get how the calculation is achieved considering that we are in the bottom five for shots on target. I work in gambling and a lot of store is given to this measure however the fact that we've gone up in the table after the Wednesday and Millwall games suggest the whole thing is utterly bogus to me. There’s a couple of ways to do these. I suspect EFL Stats has award a side 3 points if the match xG differential is positive and greater than a certain value, below that value and both sides get a point. A more informative way is to take the expected goal value of each chance created in a game and run a simulation on the chances. (So a penalty has an xG of 0.8, assign it a random number between 1 and 0, if the random number falls between 0.8 and zero a goal is scored, otherwise it is no goal). Run that for each chance in the game and you’ll get a total number of goals for each team. That’s the match score line based on xG Repeat for every game played in the Championship to date. Add up the points and compile a current table, with points and goals scored and allowed in the usual way. You have one virtual table. Repeat 10, 000 times using random number to “convert” xG into virtual goals. You’ve now got 10,000 virtual tables based on chance creation and you can see how often a team is currently top, 2nd all the way to 24th. Stoke’s current, most likely position is 7th based on xG, but that’s a bit misleading because they are 7th in 7 out of every 100 iterations. They are 8th in 6 out of every, 9th in 5/100. By the time you get to 20th there’s around a 3% chance you’ll find Stoke occupying that spot. In short, we could be almost anywhere, with a slight bias towards the top half of the table. Why use chance creation, rather than actual goals? Because chance creation has proven to be a more repeatable skill than actual goals scored or allowed. Liverpool used this approach when hiring Klopp. Dortmund were in a relegation scrap, but their chance creation indicated they were the 2nd best team in Germany at the time. |
|
|
|
Post by tachyon on Oct 22, 2019 18:26:29 GMT
How are possession stats calculated in the round? Is it a measure of time on the ball? I think it must be, number of kicks say would make no sense. If it's time then is it all time or only time when the ball is in play? What if you are lining up a goal kick for example? You're notionally in possession but the ball is not in play. It's one of the stats I pay attention to. Different data suppliers have different ways of measuring possession. The 22% comes from the number of passes in the game. Stoke 198 total passes, Fulham 684 total passes. Stoke "possession" = 198/(198+684) =22% Whether you think that's a sensible approach, I'll let you decide. Infogol had Stoke's possession as 38% |
|
|
|
Post by tachyon on Apr 29, 2018 8:41:00 GMT
[/quote]
So do we want Swansea to beat Southampton then?
Is a draw actually the worst possible outcome of that fixture for us?[/quote]
As of this morning, there's more routes to our survival if Southampton beat Swansea (because Soton's remaining fixtures are more difficult than Swansea's). A Swans win or a draw lead to around an equal number of survival routes within our current 10% chance of staying up.
But by the time that game takes places the remaining match permutations will have been greatly reduced. We might be already gone or we might be cheering for Swansea.
|
|
|
|
Post by tachyon on Apr 29, 2018 7:55:37 GMT
With the obvious exception of Southampton, yesterday's results were fairly kind to us. We now go down in around 90% of simulations of the remaining matches. In the 10 out of every 100 where we stay up the most common combination of relegated teams is WBA, Southampton and Huddersfield which happens in 41 out of every 100 survival seasons, followed by WBA, Swansea and Huddersfield (30 per 100). The rest are listed below.  |
|
|
|
Post by tachyon on Apr 27, 2018 6:41:44 GMT
[/quote] Thanks. Either you’re going to become extremely popular with those looking for betting tips, or you’re not going to be able to live this one down. No offense, but I hope it’s the latter.  [/quote] Me too:-) three% isn't zero, but it's pretty close. |
|
|
|
Post by tachyon on Apr 26, 2018 18:14:25 GMT
[/quote]???????
Is this you randomly putting in scores, playing on FM, or just your opinion?[/quote]
As PS says, it's my job.
I'm simulating scorelines for all remaining matches based on the quality of all 20 sides and then adding the points, goals scored/conceded to each team's current records to get a final league table. I'm repeating the process 20,000 times.
We come bottom 11 times out of every 100, 19th 67 times out of every 100, 18th 19 times per 100 and on three occasions we stay up.
Our most likely number of points won in the remaining games is three, which turns up in around a quarter of the simulations.
|
|
|
|
Post by tachyon on Apr 25, 2018 13:22:39 GMT
We'd stay up just under 50% of the time if we got exactly seven more points. Bad news is we get 7 points just two times in every 100 attempts from the final three games. I'm crap at maths but am I right in saying there's only a 1% chance of getting 7 points and staying up? Unfortunately, that's correct. Overall, with every permutation of possible results and likelihood they happen, we stay up around 3% of the time. |
|
|
|
Post by tachyon on Apr 25, 2018 13:05:12 GMT
Would 7 points keep us up? We'd stay up just under 50% of the time if we got exactly seven more points. Bad news is we get 7 points just two times in every 100 attempts from the final three games. |
|
|
|
Post by tachyon on Apr 9, 2018 7:50:08 GMT
We've reached the stage where only our results really matter.
If Swansea win against Everton, we go down 82% of the time, if they lose we still go down around 82% of the time.
Lose to WHU and we're 94% relegated, win and it's *only* a 68% chance.
|
|
|
|
Post by tachyon on Apr 8, 2018 10:00:36 GMT
 Here's my chances that teams start next season in the Premier League. Derby now more likely than us. |
|
|
|
Post by tachyon on Apr 4, 2018 11:23:54 GMT
Statistically this season is the most compressed table outside of the top six after 31/32 games in the history of the 20 team Premier league.
In terms of our points proximity to mid-table, we're the 3rd best 19th placed team at this stage of the season out of the 23 seasons to date.
Likewise, Southampton are the 3rd best 18th placed team. Palace are the 4th best 17th placed side.
Counting downwards Everton & Bournemouth are respectively the 22nd out of 23rd "best" 9th and 10th placed team. Watford are the 21st best 11th placed side.
So all the teams towards the top of mid table are doing historically poorly compared to midtable and those at the bottom are gathering points towards the top end of historical expectations, again compared to mid table.
Basically, it's turned into a variance driven crapshoot.
|
|
|
|
Post by tachyon on Apr 3, 2018 21:04:08 GMT
Bookies odds for Brighton vs Huddersfield work out as an implied probability of 0.52 a Brighton win, 0.29 the draw and 0.19 a Huddersfield win.
So just under half the time they expect Huddersfield to get at least a point and just under 20% of the time they expect they win.
|
|
|
|
Post by tachyon on Apr 3, 2018 20:24:58 GMT
[/quote]
How many points do you have Huddersfield finishing on?[/quote]
Median points total for Huddersfield 36 points, Just 33 for us. Pretty much in line with the bookies.
|
|
|
|
Post by tachyon on Apr 3, 2018 19:29:17 GMT
 I've currently got 36 as our break even point based on all remaining fixtures and current abilities of all teams. If we get there we stay up as often as we go down. Problem is we only get 36 or more points around a quarter of the time. At the moment our chances of starting 2018/19 in the Premier League is the same as Derby County doing the same. Just over 20%. |
|


 [/quote]


