|
|
Post by tachyon on Jan 18, 2020 10:29:21 GMT
Jack's had a pretty poor season. we only have Kamil Grabara at Huddersfield saving a fewer than expected number of shots based on the quality of those attempts than Jack. If you look at every attempt on goal JB's faced, you'd expect an average keeper to let in around 24 goals. Omitting the two own goals, Jack's let in 30. There's around a 95% chance an average keeper does better than that. Not good. Here's the chance of each shot he's faced will result in a goal & the red bars are the actual goals. Probabilities run from 1 for "will result in a goal every time" to 0 for "will never be a goal". The likelihood of a goal is based on where and how the shot was taken from, where on the goal frame it is directed, how hard it's kicked, whether it is deflected, if it has swerve, etc. It's called xG2 just to annoy people :-) View AttachmentGood news is xG2 is much more transient than xG Is there a key for the red and blue bars? Sorry, reds are goals conceded, blues are saves. They're in chronological match order. Higher the bar the more difficult the save based on the pre and post shot characteristics. This is Jack from 2017/18 (red goals/green saves) Attachment DeletedThis season he's let in virtually all of the difficult ones and a fare few of the easier ones as well. |
|
|
|
Post by tachyon on Jan 16, 2020 14:42:19 GMT
Jack's had a pretty poor season. we only have Kamil Grabara at Huddersfield saving a fewer than expected number of shots based on the quality of those attempts than Jack. If you look at every attempt on goal JB's faced, you'd expect an average keeper to let in around 24 goals. Omitting the two own goals, Jack's let in 30. There's around a 95% chance an average keeper does better than that. Not good. Here's the chance of each shot he's faced will result in a goal & the red bars are the actual goals. Probabilities run from 1 for "will result in a goal every time" to 0 for "will never be a goal". The likelihood of a goal is based on where and how the shot was taken from, where on the goal frame it is directed, how hard it's kicked, whether it is deflected, if it has swerve, etc. It's called xG2 just to annoy people :-) Attachment DeletedGood news is xG2 is much more transient than xG |
|
|
|
Post by tachyon on Jan 5, 2020 10:28:06 GMT
Hi mate, most are x,y co-ordinates rather than x,y,z. Tracking data will help with that omission, but it's expensive and it can take longer to process than it takes to actually play the game.
You can infer the added difficulty from some of the qualifiers that come with the data. For example, from a cross, from a corner and passes have over a dozen qualifiers, such as lofted, chipped, from keeper kick etc.
There's a couple of data suppliers, Opta probably the most well known, and Statsbomb, founded by an ex Brentford guy and former Pinnacle quant. The latter are giving the former a run for their money by including richer data feeds.
Some models give a subjective xG based on just the opinion of the collectors, others use an algorithm.
We get the xG out on the Infogol app's shot map in real time for all major European leagues and the Championship, so we use the latter. So we're tied to the instantaneous data feed coming from Opta's Leeds centre and they go through a post game checking process that can lead to alterations being made.
xG sort of serves two masters. It has to be descriptive, but also predictive. The greater you reflect the former, the more llikely you are to overfit what happend in the past and less likely you generalise into the future.
We try for the fewest inputs into the algorithm, without compromising the accuracy on out of sample test data.
|
|
|
|
Post by tachyon on Jan 5, 2020 9:22:34 GMT
If you read the link to Liverpool’s TW describing their EPV model, you’ll know that their group of mainly Welsh physicists and chess champions have an xG model that puts a goal probability value on every possession anywhere on the pitch. We call our EPV model a non-shot xG model, but it’s the same thing. Having the ball on the edge of your own box has a low goal probability value, but it’s much higher if you’ve moved the possession to the edge of your opponent’s box. Instead of a couple of actual goals or a dozen or so attempts, you’ve now got typically a couple of thousand quantified events for each game. Just to pick a random example, we have 1835 events that led to a change in goal probability for the Wigan Fulham game in September, comprising passes, ball carries, interceptions, tackles, throw ins etc. This information is most usefully used to see where, how and by who a side is progressing the ball. Who’s holding the ball up well, who’s giving it away, where a side can be pressed and where you should try to disrupt their most profitable attacking areas of the field. You can generate tons of tactical/player evaluation stuff from this data in the form of heat maps etc, but as a general overview you can simply tally each players positive and negative contributions in a game to get a rating, expressed on a 0-10 scale. We currently do this for all the main European leagues and competitions, including the Championship. We just take a basic feed for the FA Cup because sides largely play understrength teams. Sorry shipshape :-) Here’s Stoke in 2019/20 in the Championship under NJ and under MO’N. Therefore, small sample and strength of schedule caveats. Attachment DeletedA couple of quick takeawys. It doesn't include the caretaker game. It omits very low minute cameos. MO'N has had slightly easier games. Keeper's are evaluated on distribution & cross claiming. but mainly on shot stopping (or not), depending on the post shot characteristics. Pinged into the top corner with power from close range is obviously more difficult than a mishit shot from distance that's straight at you. On that basis Jack's been worse than AF (fairly obvious to the eye test). Although the good news is that keeper under/over performance is almost as random a trait as "clinical finishing". JM's done very well under MO'N, probably position dependent. Ryan's return is very welcome. JM, SC, SV, TS & JA have been our most productive, if somewhat inconsistent performers. TC and SV have been more impressive under MO'N. |
|
|
|
Post by tachyon on Jan 4, 2020 10:43:11 GMT
I think it’s fair to say that sample size is crucial. You’ll see big swings, plus and minus, on an individual game basis, but the longer you use xG as your prediction tool the more likely you are to be successful in predicting outcomes provided you remain disciplined and don’t let emotion come into play. From what I’ve seen, xG is consistently more accurate in predicting final league positions than either bookmakers or fans (ie if you pooled all fans predictions and came up with a mean league position over, say, ten seasons, that method would be less accurate overall in successfully predicting Stoke’s final league position each season than xG would be). Great point. You can look terrible or brilliant in small sample sizes. (TC warning alert) xG expands sample size compared to actual goals because there are more chances created than goals scored. Non shot xG that quantifies every tackle, pass, interception, off the ball run, post shot keeper save, long throw :-) expands the sample size 50 fold. |
|
|
|
Post by tachyon on Jan 4, 2020 10:23:41 GMT
Some insightful comments. Bottom line is that an xG approach predicts future goals better than other current metrics, including previous goals. It has more signal and less noise. Outcome based evaluations are full of randomness and prone to human cognitive biases, which leads to faulty conclusions. Chris Sutton’s “he must score there” (for every opportunity….ever) & Owen Hargreaves’ “he has to be more clinical” The only current pundit who gets the probabilistic nature of goal scoring chances is Michael Owen. Prime example 1. Clinical finishing is a myth (sorry Tyrese). The biggest scoring over performers over the first half of a season based on the quality and quantity of their chances perform dead average in the second half. Same for the “couldn’t hit a barn door” brigade, as a group they regress towards the number of goals you’d expect based on the chances they are given. The skill is getting into good scoring positions, once there the identity of the chance taker is largely irrelevant. The skill differential at converting chances is very small at the professional level. (tin hat on). 2) xG didn’t defend or champion Jones, it simply pointed out that Stoke had scored fewer and conceded more goals than the quality of the chances suggested they should and natural regression was on the cards. Whether he was generating the level of process appropriate to the amount of investment was for a different type of analysis. Having taken 1 point from 21, he then took 7 points from the next 21. We’ve since taken 16 points from 36 with a new manager and an interregnum during an easier run of games. So, we’re gradually getting the rewards our process merits and we’re even slightly improving the process (although don’t get carried away with how much effect a manager can have other than by changing the playing squad) 3) Many clubs routinely use xG. For a fine example of how it is used at Liverpool check out this. linkTim’s describing Liverpool’s non shot xG model that doesn’t just quantify chances it quantifies every on field action. We also have a non shot model for all the major European leagues, if I’m feeling brave enough I’ll post up the figures for all our players under Jones & MO’N PROCESS. Keep doing beneficial things for the team. OUTCOME. Which one-off reality the probabilistic universe throws your way. |
|
|
|
Post by tachyon on Jan 3, 2020 10:31:02 GMT
Bit of a strawman, that. xG models had Stoke coming down from the Prem as a mid table Championship team. Bookmakers had us as favourites for promotion. At the start of this season xG models had Stoke as the 11th best team in the Championship (all documented). Bookmakers had us as the joint fourth best team. Only one evaluation process has continually over estimated how good Stoke have been since relegation and it hasn't been xG, it's been the bookies. Stone cold fact. Teams aren't assessed on the current table, xG or otherwise. They are assessed on a weighted average of at least a full season's worth of games, if not more. The bookies couldn’t predict Rowett being inept. Expected goals couldn’t predict that but also didn’t take into account that our chances and therefore expected goals came against superior opposition in the prem. In effect it was correct by being wrong twice. Which is one way to look at how it operates in general. It's wrong multiple times over the course of the season which eventually evens out.
For this season, we were on course for relegation until we took action and changed manager who in turn changed the tactics and personal which is what is produced the turn around. Unless it predicted us changing manager its not really valid to claim this season as a victory for it either. Waiting it out didn't work and much to my chagrin wasn't going to. It was a negative downwards spiral which effected confidence and therefore finishing.
People who used it to support Jones didn’t take into account that it only models chances and requires corrective behaviors like replacing the manager.
1) Of course it takes into consideration that we came up against superior opposition in the Prem. 2) we've never been odds on to go down, so "on course to survive" would be more apt. 3) xG looks at the process & ours was/is mid table. If the process improves, so does the xG evaluation, but it does so gradually, not in a knee jerk way. |
|
|
|
Post by tachyon on Jan 3, 2020 8:29:11 GMT
The very concept that Jones could have got this squad in a play off position is beyond ludicrous and that's my problem with it. Things weren't just about to click at anytime soon and to anyone with even a casual interest in football it was entirely obvious that we were far more of a relegation outfit than a play off one. Its presumption of equality of ability and inability to factor in things like Jones' utter lunacy and the fact the players thought he was a prick means it has serious flaws. I don't mind people referencing it as a guide and occasionally you might get a decent insight into who are the underperforming and overperforming sides, it's when people use it as a bible it pisses me off. Jones's Stoke is probably the best example of all, on this metric we were the biggest underperforming team in the UK under him, yet any basic empirical research into what a car crash we were on and off the pitch would have told you that we were exactly where we deserved to be. If you used the xG table as a basic guide to betting on Stoke under Jones you'd have far more money believing your own eyes (and the actual table) than this model and that's a stone cold fact. Bit of a strawman, that. xG models had Stoke coming down from the Prem as a mid table Championship team. Bookmakers had us as favourites for promotion. At the start of this season xG models had Stoke as the 11th best team in the Championship (all documented). Bookmakers had us as the joint fourth best team. Only one evaluation process has continually over estimated how good Stoke have been since relegation and it hasn't been xG, it's been the bookies. Stone cold fact. Teams aren't assessed on the current table, xG or otherwise. They are assessed on a weighted average of at least a full season's worth of games, if not more. |
|
|
|
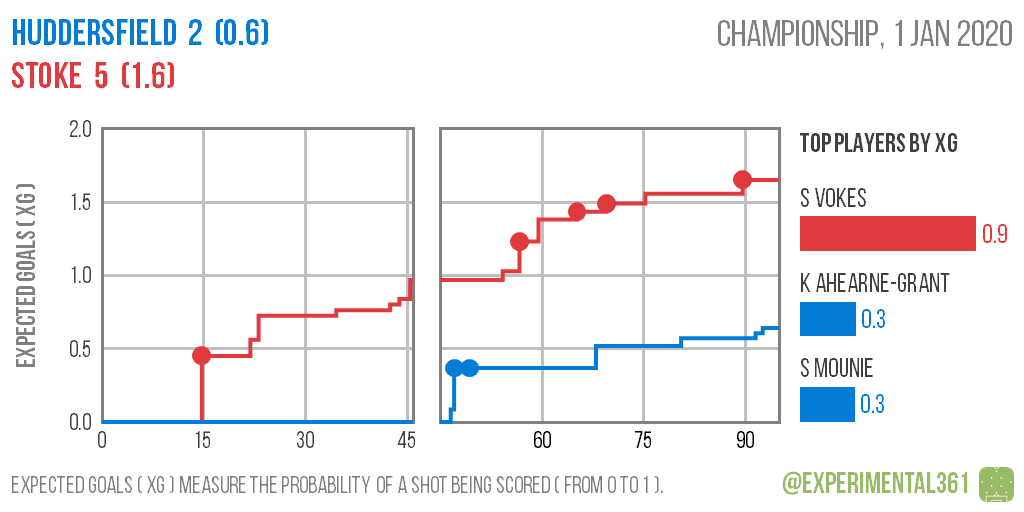
Post by tachyon on Jan 2, 2020 8:46:58 GMT
Shows what a load of old bollocks it is No, not really. It shows what a powerful predictive and descriptive tool it is compared to mere outcome based conjecture. xG projected we'd be out of the bottom three in time for the New Year when we had just one point from 21. We were. It has been projecting we'd get a final points total in the low to mid 50's and we're on course for that as well.  xG chances from yesterday gave us a 75% chance of winning the game and a 95% chance of taking at least a point. Can't really argue with that. A fifth of the time we'd beat Huddersfield by three or more goals having created and allowed those quality and quantity of chances. We created two big chances to huddersfield's one and that's another promising, process based performance indicator. A lot of low probability efforts are prone to a wider varience in outcome. Occasionally, lots will go in, like yesterday, more typically they won't, no matter how "clinical" we want to believe our players are. |
|
|
|
Post by tachyon on Dec 30, 2019 9:32:27 GMT
Attachment DeletedHere's the xG created and allowed under the three managers we've had this season. The Wednesday game is a slight outlier in a small sample batch, but even without it there's been a slight uptick in our creativity and improvement in the quality and quantity of chances we're allowing under MON
|
|
|
|
Post by tachyon on Dec 27, 2019 8:15:09 GMT
Simply curious as to why you think the final score is all that matters and why the aversion to an alternative, wider ranging approach :-) Is there anything else? Points for good behaviour, or not snotting on the pitch? No you get nowt extra, but the goals you score and allow tend to come from the chances you create and allow. That's where xG takes a deeper dive into a side's performance levels instead of bouncing around like demented tiggers every time Stoke win or lose. "Get out of my club" / "A corner's been turned" I do however add 0.01 of an xG to a team's xG rating for every incident of ear cupping. |
|
|
|
Post by tachyon on Dec 27, 2019 7:58:53 GMT
Simply curious as to why you think the final score is all that matters and why the aversion to an alternative, wider ranging approach :-) I enjoy this statistical analysis. Have you update the probability of relegation after today’s win? cheers, around 20% chance we go down. Median final points projection is back up to 54, median final position 19th |
|
|
|
Post by tachyon on Dec 26, 2019 19:58:21 GMT
Cool, where did the "only stat that matters" predict we'd be sitting in the table on Boxing Day back in September? Yeah ok mate, you sit and play with your stats if it makes you feel better. Me, I’ll just watch real football, see what the final score is and then look at the league table. Simply curious as to why you think the final score is all that matters and why the aversion to an alternative, wider ranging approach :-) |
|
|
|
Post by tachyon on Dec 26, 2019 19:05:44 GMT
It’s all pointless drivel. The only stat that ever matters in football is the full time score. Cool, where did the "only stat that matters" predict we'd be sitting in the table on Boxing Day back in September? |
|
|
|
Post by tachyon on Dec 24, 2019 21:27:23 GMT
P1 of this thread.... of the last 10 seasons, the club who were bottom at Xmas has been relegated in all but 1 of those seasons. We’re fucked. Thanks. I missed that before. "Bottom at Christmas" needs context, particularly how close you are to your rivals. Of those last ten seasons only one team was closer to their rivals than Stoke are now and they were the side who stayed up. The nine who got relegated were all further adrift than we currently are. Bookies current implied probability for us to go down is ~ 22% |
|
|
|
Post by tachyon on Dec 13, 2019 20:00:33 GMT
Sure. He collects his own data in house & uses it at Brentford. But the basic premise of xG is the same. IIRC Tippet's recent book explicitly states that there's no skill differential in conversion rates. I do see that as the major flaw though mate. I think the differentials are poorly calibrated. I genuinely know that traders at other firms are rowing away a little bit but that's not saying that the system itself can't evolve. It comes up with too many absurdities in my eyes. Work in the same industry. Models are continually calibrated against out of sample data. It certainly works well in longer term markets. Sell of Reading after the year they nearly got promoted, Atalanta for a top four finish last season, Watford for the drop this year, Avoid Stoke when favs for promotion. No value in tomorrow's game, though for any result :-) It's a tool, but a very useful one. |
|
|
|
Post by tachyon on Dec 13, 2019 19:38:15 GMT
The basic premise isn't that all players are equal. They differ in their ability to get on to the end of chances and teams differ in their ability to create those chances. It is the conversion rates of those chances that is a narrowly banded skill and under or over performance at the sharp end of a scoring opportunity invariably regresses to the population mean (except Messi). It is used in the betting industry, for instance Matthew Benham's Smartodds uses xG extensively. I've met Benham many times. He's a genius. I know he relies in his own models much more than any external ones. Sure. He collects his own data in house & uses it at Brentford. But the basic premise of xG is the same. IIRC Tippet's recent book explicitly states that there's no skill differential in conversion rates. |
|
|
|
Post by tachyon on Dec 13, 2019 19:34:03 GMT
Can I see any stats on how many Danny Batth headers go to a team-mate, rather than spazzed into touch, or straight up in the air? You can. But then we'd have to start talking about non-shot expected goals............ |
|
|
|
Post by tachyon on Dec 13, 2019 19:25:12 GMT
What's idiotic is your apparent lack of understanding of statistics. It isn't an exact science - it's an approximation. For the majority of clubs their actual and EG position will be pretty close - but the nature of any statistical measure is the potential for "outliers" - oddball scenarios that seem to fly in the face of the "expected" outcome. "Outliers" do not disprove the value of the statistical measure - they are an expected feature. An outlier is evidence of shit happening - it doesn't mean it's all shit. Looking at that table Stoke (bad shit) and Bristol (good shit) happen to be this years "outliers". So the clubs they have most wrong prove it's a good system?! I work in gambling and firms are becoming more and more dubious about it. The basic premise that all players are equal is just wrong. The basic premise isn't that all players are equal. They differ in their ability to get on to the end of chances and teams differ in their ability to create those chances. It is the conversion rates of those chances that is a narrowly banded skill and under or over performance at the sharp end of a scoring opportunity invariably regresses to the population mean (except Messi). It is used in the betting industry, for instance Matthew Benham's Smartodds uses xG extensively. |
|
|
|
Post by tachyon on Dec 12, 2019 18:44:45 GMT
The biggest value expected goals or xG brings to the table is in analysing longer term trends. If you're continually creating more chances than the opposition, even if you're not always converting those chances, it's very likely that over time your outcomes (results) will adhere more closely to your process (xG differential). After six games Stoke had one whole point from a possible 18 (results dire), but a fairly equal share of the xG (process not great, but not terrible) in their matches to go with a similar trend from the previous season. At that season low in September, Infogol simulated the remainder of the season using the xG ratings of all 24 teams to see when it would be more likely than not that Stoke would claw their way out of the bottom three and posted it on Twitter. View AttachmentWe estimated Stoke would start to be slightly more likely than not to escape from the drop zone by game week 22. That's next week and with favourable results we could hit the scheduled recovery at the earliest predicted time.....or we could take until week 30 or we might not manage it at all. That's what projections are, they come with an uncertainty, grouped around the most likely outcome. XG from the start of September has done a pretty good job of projecting where Stoke would be half way through December and currently it thinks our median final points total will be 54, our final median finishing position will be 18th and we currently have a 21% chance of relegation. Obviously you are a supporter of the process, so why title the thread "nonsense"? Wouldn't "Nostradamus step aside, Expected Goals is here" be more catchy? It's been portrayed as nonsense by the majority on this forum, with some admirable exceptions. Hence the added "" "" |
|
|
|
Post by tachyon on Dec 12, 2019 17:04:49 GMT
I prefer it to "Gregory is terrible at finishing", but each to his own :-) Isn't that its weakness though? It basically assumes that Gregory should finish a goal like Mitrovic should because they're in the same section! Conversion rates are both volatile and the skill gap between players is narrow. Lewandowski is over performing his xG by 11% this season. Last season he under performed it by around 20%. Ronaldo under performed his xG last season and Mitrovic also did last season. If you take the biggest over performers, "clinical finishers" if you like, as a group they always regress to being neither under or over performers in future trials. Unless your name is Messi and it is certainly counter intuitive, but finishing IS a skill, of course, but the talent differential between players in the same leagues is invariably too small to measure. The observed difference is almost always random variation that eventually regresses to the expected xG rate. |
|
|
|
Post by tachyon on Dec 12, 2019 16:31:55 GMT
I sit somewhere between Bayern and tachyon wrt xG. I think it could be improved. Firstly, I don’t get some of the percentages it come up with, but I’m looking at it subjectively and the calculation is purely objective as far as I understand it. A bigger problem is the tendency to simply add the chances together. Currently (as I understand it), if a player misses a penalty (80%) and the rebound is spooned over by another player (say 50%), then the team gets 1.3 xG for that phase of play. Clearly makes no sense. Perhaps xG could provide individual chance data, but “sum” them more cleverly to acknowledge that an individual attack could never generate more than one goal. I wrote a little script on Python last year (just for coding practice) that generates a few graphs of the season. You can choose how many matches you want to average over (I’ve done 5 in the ones below). I included xG, just because it gave me more data to play with. This is our season so far (for what it’s worth). The “goals minus xG” essentially shows you how well or badly we’re doing vs what’s “expected”. At the beginning of the season, we were conceding a goal more than was expected every game as Butland was having his nightmare period. We also went through a phase of scoring fewer goals than would be expected. Both of these have settled down a bit now.     Nice graphs, Related chances have been addressed. The under the hood simulations don't allow you to score more than once in simulations from related chances. Aggregated totals trade simplicity for granular insight. We think it's the better of two compromised choices. There's lots of issues that have been addressed, but they usually stay in house. xG timelines (when you create chances) and current score-line and time remaining impact on xG, also was it better to create lots of small chances or fewer better ones. Most issues just tweak, rather than fundamentally alter the conclusions. We tend to run 10 game rolling averages spread over multiple seasons to look at longer term trends. Single game xG is more a descriptive than predictive metric. For overall team ratings we take the last 40 games, weighted towards the most recent xG outcomes. |
|
|
|
Post by tachyon on Dec 12, 2019 15:55:41 GMT
No-one has ever claimed it is the be all and end all. But it is demonstrably a better indicator of future perfromance than actual goals and isn't prone to the numerous congitive biases that go into purely opinion based assessment (now that is subjective). It is the mainstay of every analytically run football (just for Bojansstalker :-)) from Liverpool downwards and appeared to project three and a half months ago that table topping Swansea were just a bog standard mid table team & Stoke would be on the verge of climbing out of the bottom three by this coming weekend. I prefer it to "Gregory is terrible at finishing", but each to his own :-) People refer to is as fact. It isn't. We haven't been unlucky this season, anyone who has watched can see that. The figures don't tally with what has actually gone on. I never refer to it as fact, you'll have to take that up with those who do. Totally agree, "The figures don't tally with what has actually gone on" we've created 28 xG and allowed 26 xG. That's a mundane mid-table process, not a bottom three one. Maybe not what a side with our resources should aspire to but sometimes your probabilistic process flips 2 heads out of ten purely by random variance. |
|
|
|
Post by tachyon on Dec 12, 2019 15:44:24 GMT
No-one has ever claimed it is the be all and end all. But it is demonstrably a better indicator of future perfromance than actual goals and isn't prone to the numerous congitive biases that go into purely opinion based assessment (now that is subjective). It is the mainstay of every analytically run football (just for Bojansstalker :-)) from Liverpool downwards and appeared to project three and a half months ago that table topping Swansea were just a bog standard mid table team & Stoke would be on the verge of climbing out of the bottom three by this coming weekend. I prefer it to "Gregory is terrible at finishing", but each to his own :-) I don't think that's always the case, at least using the same players. Expected goals uses an average benchmark for finishing, if the strikers are significantly below that benchmark and missing the big chances like Gregory we'll always be below expected goals. The true talent range for "finishing ability" is very narrow and it is very difficult to rule out random variation as a major cause for under/over performance in the sample sizes that are available, particularly with confounding factors such as peak age improvement/decline and changing player environment. Over-fitting recency bias of "Gregory is a rubbish finisher" & "(the young) Rashford is clinical" to a model is a much bigger danger to faulty player evaluation. |
|
|
|
Post by tachyon on Dec 12, 2019 15:27:51 GMT
Because a person gives a chance a rating based on a range of things. Different people have different ways of measuring xg. It's not this bee all and end all stat, it's subjective and people don't treat it as such. No-one has ever claimed it is the be all and end all. But it is demonstrably a better indicator of future perfromance than actual goals and isn't prone to the numerous congitive biases that go into purely opinion based assessment (now that is subjective). It is the mainstay of every analytically run football (just for Bojansstalker :-)) from Liverpool downwards and appeared to project three and a half months ago that table topping Swansea were just a bog standard mid table team & Stoke would be on the verge of climbing out of the bottom three by this coming weekend. I prefer it to "Gregory is terrible at finishing", but each to his own :-) |
|
|
|
Post by tachyon on Dec 12, 2019 14:56:59 GMT
Gregory is terrible at finishing. Xg is made up nonsense. I love evidence based argument..... It doesn't need to be evidenced. Xg is made up. That's what it is. How so? |
|
|
|
Post by tachyon on Dec 12, 2019 14:52:44 GMT
[/quote]
Gregory is terrible at finishing.
Xg is made up nonsense. [/quote]
I love evidence based argument.....
|
|
|
|
Post by tachyon on Dec 12, 2019 14:48:31 GMT
What the fucking hell is soccer?[/quote] It's what ATV, Billy Wright, Gary Newbon, Nick Owen, Peter Brackley and Peter Lorenzo used to show on Sunday afternoons. Usually featured a hugely entertaining Stoke City team from the 1970's and the occaional mudfest from the Baseball Ground. You're probably too young :-) [/quote] They called it Star SOCCER |
|
|
|
Post by tachyon on Dec 12, 2019 14:47:13 GMT
[/quote]What the fucking hell is soccer?[/quote]
It's what ATV, Billy Wright, Gary Newbon, Nick Owen, Peter Brackley and Peter Lorenzo used to show on Sunday afternoons.
Usually featured a hugely entertaining Stoke City team from the 1970's and the occaional mudfest from the Baseball Ground.
You're probably too young :-)
|
|
|
|
Post by tachyon on Dec 12, 2019 14:15:07 GMT
I'm an 'expected goals' believer. It's as close as you'll get to a scientific explanation of 'unlucky' and we all know luck changes. We haven't been unlucky though. The mistakes the keeper and defence keep making aren't bad luck. Gregory missing sitters isn't bad luck. It's XS, expected shiteness. Chance creation or chance prevention is a more repeatable trait than either chance conversion or save percentage. The latter two are much more prone to random variation (or bad luck) especially in small samples. Neither Gregory nor Butland would have been professional players for 6 & 9 seasons respectively without possessing adequate Championship standard finishing and shot stopping ability. Having a player who can get himself on the end of 0.3 non penalty xG per 90, as Gregory has is the important number. Also, a side that has conceded 1.25 xG per 90 but allowed 1.67 actual goals isn’t going to continue trading at such a deficit. Results trend to the process. |
|