|
|
Post by estrangedsonoffaye on Oct 30, 2019 11:24:25 GMT
The metric I saw suggested it was 4.85. [/quote] 4.85 xG gets you 9 or more goals around 4% of the time. If anyone want's to know how the 4.85 is calculated, feel free to ask because I calculated it :-)[/quote] Backs up what I was saying about the 9-0 being an outlier in my above post. I think 4.85 was very accurate in the context of the Leicester-Soton game for the reasons I said above, 4 of the goals were extremely low % that ended up in the net. I don't get why people get so angry about a stat which basically contextualises "everything went their way" or "he has to score that". |
|
|
|
Post by Deleted on Oct 30, 2019 11:36:14 GMT
this is laughable and Nathan is showing no class
Life is unfair , just go to Great Ormond Street Hospital or Donna Louise Trust
But perhaps , because its a game , with simple rules , football is fair . The entire point of the game is to score the most goals and the team that scores the most goals, always wins .
Nobody has been more successful in sport over the last decade than ALL BLACKS coach Steve Hansen and he showed on Saturday that he knows how to lose ( even though he almost never does !!)
NJ should take a leaf out of Hansen's book and just be honest
|
|
|
|
Post by nott1 on Oct 30, 2019 12:02:37 GMT
this is laughable and Nathan is showing no class Life is unfair , just go to Great Ormond Street Hospital or Donna Louise Trust But perhaps , because its a game , with simple rules , football is fair . The entire point of the game is to score the most goals and the team that scores the most goals, always wins . Nobody has been more successful in sport over the last decade than ALL BLACKS coach Steve Hansen and he showed on Saturday that he knows how to lose ( even though he almost never does !!) NJ should take a leaf out of Hansen's book and just be honest He offered to take a reporter outside when he asked a question.....not very classy, just your average thug and a bad loser! |
|
|
|
Post by Deleted on Oct 30, 2019 12:17:23 GMT
this is laughable and Nathan is showing no class Life is unfair , just go to Great Ormond Street Hospital or Donna Louise Trust But perhaps , because its a game , with simple rules , football is fair . The entire point of the game is to score the most goals and the team that scores the most goals, always wins . Nobody has been more successful in sport over the last decade than ALL BLACKS coach Steve Hansen and he showed on Saturday that he knows how to lose ( even though he almost never does !!) NJ should take a leaf out of Hansen's book and just be honest He offered to take a reporter outside when he asked a question.....not very classy, just your average thug and a bad loser! Hansen explained that England deserved to win and why .
You are right that one reporter wouldn't leave it that ,and insisted his players didn't even try , which was uncalled for , given that they had been physically battered by Sam Underhill and co , and were still coming back for more . Then you are right , Hansen lost his rag .
But point 1 , Nj wont see where his team went wrong and why they lost ( unlike Hansen ) But point 2 , in a very different game , his players never put in the physical effort of England or the all blacks And point 3 , NJ doesn't have Hansen's win rate , which is about 99 %
I think point 1 and point 3 are related and explain why Hansen is a winner and NJ isn't
|
|
|
|
Post by thehoof on Oct 30, 2019 17:17:37 GMT
XG is a useless statistic which means nothing. Leicester scored 9 against Southampton but had an XG rating of 2.9 There is only one statistic that counts and that is where you sit in the table. The metric I saw suggested it was 4.85. And it's not that unreasonable, look at some of the goals: Maddinson direct free kick from 25 yards - Don't see that too often, probably 1 in 20 free kick from that position? Perez ridiculous back post volley - Given the angle, the difficulty on controlling that shot and the speed of the ball, certainly not a gimme. Tielemans somehow squeezing it through 4/5 bodies - The shot literally goes through the legs of 3 players cleanly, again I'd say that's blocked most times. Perez shot that beats the keeper on the near post should be saved. That's 4 goals that could well be argued shouldn't go in most of the time which to me suggests a figure of 4.85 is reasonable. How often do you see 9-0s in football, it's an exception to the rule so therefore would lie outside most statistical models anyway. But there are limits to its utlity, which is why I disagree with it being used as gospel without consideration to other factors that up to now stats can't answer. But it's not meaningless at all. For example last year, our conversion rate was as good as Villa's for chances, but Villa were simply creating double the numbers of chances that we were in game. Xg would help to show that by demonstrating our chances were decent but there's not enough of them and if we miss a sitter then it's unlikely we'll get another chance like it. Which again, for me is pretty accurate in the context of last season. How many points do you get for XG? Come the end of the season will your position in the table be more indicative of how you have played, or will hiding behind a “favourable” XG statistic be what is used? Statistics can be used to justify anything- if you dismantle your Villa example, the meaningful stat would have been the number of Chances created- given the same conversion rate the team with most chances will score the most goals. |
|
|
|
Post by estrangedsonoffaye on Oct 30, 2019 17:30:51 GMT
The metric I saw suggested it was 4.85. And it's not that unreasonable, look at some of the goals: Maddinson direct free kick from 25 yards - Don't see that too often, probably 1 in 20 free kick from that position? Perez ridiculous back post volley - Given the angle, the difficulty on controlling that shot and the speed of the ball, certainly not a gimme. Tielemans somehow squeezing it through 4/5 bodies - The shot literally goes through the legs of 3 players cleanly, again I'd say that's blocked most times. Perez shot that beats the keeper on the near post should be saved. That's 4 goals that could well be argued shouldn't go in most of the time which to me suggests a figure of 4.85 is reasonable. How often do you see 9-0s in football, it's an exception to the rule so therefore would lie outside most statistical models anyway. But there are limits to its utlity, which is why I disagree with it being used as gospel without consideration to other factors that up to now stats can't answer. But it's not meaningless at all. For example last year, our conversion rate was as good as Villa's for chances, but Villa were simply creating double the numbers of chances that we were in game. Xg would help to show that by demonstrating our chances were decent but there's not enough of them and if we miss a sitter then it's unlikely we'll get another chance like it. Which again, for me is pretty accurate in the context of last season. How many points do you get for XG? Come the end of the season will your position in the table be more indicative of how you have played, or will hiding behind a “favourable” XG statistic be what is used? Statistics can be used to justify anything- if you dismantle your Villa example, the meaningful stat would have been the number of Chances created- given the same conversion rate the team with most chances will score the most goals. This is the problem though, I don’t think “oh we had good xg therefore everything is fine”. It’s a tool, the same way anything else is a tool to help you make judgements. Stats don’t do anything on their own like I’ve said in other posts, they signpost managers towards potential issues and its the down to their intangible talent to sort said issues out. The issue isn’t the stats, it’s how they are presented as alternatives for actually sorting stuff out. They’re constantly developing and are here to stay, Man City employ 11 Data Analysts full time. It’s a bit like how 10 years ago everyone thought directors of football were bizarre concepts and now its pretty much accepted you need one to compete. With regard to the final table the XG table last year correctly predicted 7/9 teams that featured in the top 6 and bottom 3, for a developing stat that isn’t perfect, that’s a pretty good effort in a league that is notoriously hard to predict. |
|
|
|
Post by Olgrligm on Oct 30, 2019 17:53:53 GMT
Thanks for that it explains a bit more but still seems to suggest that there is a reason why we should stick to Nathan as it would seem his method is working but we can't score the goals our play deserves in most matches. Interesting that Klopp was chosen by this method. I hadn't realised he was in a relegation fight when Liverpool appointed him. Gives us hope yet. [/quote] The biggest disconnect is between xG allowed (1.2/game) & goals allowed (1.8/game). The usual reason for this is individual errors (check) or opponents pinging shots into the top corner from 30 yards. Neither tend to persist. Either your keeper stops making howlers or they're replaced by someone else (check) and the rate you actually concede goals (the outcome) tends towards the quality & quantity of chances you allow (the process). The "we should be 6th" stats based narrative needs placing in context. If you tally up all 10,000 simulated iterations of the league based on the chance quality & quantity created and allowed in every game to date, the likelihood that Stoke & everyone else * could* occupy a particular range of league positions looks like this. Attachment DeletedThe red is where a side actually is, the blue + % figure is how likely they are to occupy that range of positions. Our most likely position is between 7th & 14th (it's a 43% chance). The bottom line is we're 23rd but we have the process of a side that is most likely to be somewhere between 7th & 14th & that's the basis you should judge our ability to beat the drop. Compare that to Barnsley who are bottom & based on xG deserve to be in that position. That's why xG is useful & partly why Barnsley are a lot shorter price to go down than we are. Bottom line. Football is a low scoring sport where randomness has a very big effect, especially where there's lots of teams of similar underlying quality.[/quote] I don't have anything useful to add apart from that, as somebody who occasionally dabbles in data science and machine learning, I find your occasional posts really interesting. |
|
|
|
Post by samstokie1 on Oct 30, 2019 19:28:09 GMT
We are in a false position, we should be 24th not 23rd
|
|
|
|
Post by tony1234 on Oct 30, 2019 21:39:28 GMT
|
|
|
|
Post by thehoof on Oct 30, 2019 22:34:30 GMT
How many points do you get for XG? Come the end of the season will your position in the table be more indicative of how you have played, or will hiding behind a “favourable” XG statistic be what is used? Statistics can be used to justify anything- if you dismantle your Villa example, the meaningful stat would have been the number of Chances created- given the same conversion rate the team with most chances will score the most goals. This is the problem though, I don’t think “oh we had good xg therefore everything is fine”. It’s a tool, the same way anything else is a tool to help you make judgements. Stats don’t do anything on their own like I’ve said in other posts, they signpost managers towards potential issues and its the down to their intangible talent to sort said issues out. The issue isn’t the stats, it’s how they are presented as alternatives for actually sorting stuff out. They’re constantly developing and are here to stay, Man City employ 11 Data Analysts full time. It’s a bit like how 10 years ago everyone thought directors of football were bizarre concepts and now its pretty much accepted you need one to compete. With regard to the final table the XG table last year correctly predicted 7/9 teams that featured in the top 6 and bottom 3, for a developing stat that isn’t perfect, that’s a pretty good effort in a league that is notoriously hard to predict. I am not saying that you cannot use statistics to help reach a valid conclusion, but you can’t take one statistic on its own to try and present a reasoned explanation as to how a situation will develop- hence Actuaries don’t use statistics solely based on life expectancy- and I think that this is the point that you make with Man C. Data Analytics team. My issue with XG is that Nathan Jones and presumably what passes for the SCFC Data group believe that this stat in isolation shows that we are in a false position; if you added in shots on target , forward passes made, opposition goalkeeper saves made etc (all straightforward metrics to calculate) and then converted this into a meaningful statistical measure then I’m pretty sure his argument that we are in a false position would fall flat on its face. |
|
|
|
Post by robstokie on Oct 31, 2019 23:32:30 GMT
What doesn’t he understand re losing 10 games out of 14 FFS. We won 14 out of 14 mate. 10 "false" losses don't actually get counted at the end of the season in Nath's world I look forward what he thinks is the promotion party in the middle of March - well, he will be taking us out of this division, credit where it's due |
|
|
|
Post by telfordstokie on Nov 1, 2019 7:49:08 GMT
xG stats have to be taken with an absolutely massive pinch of salt. Realised that after that Stoke Analytics account posted the figures after the Preston game which showed we had narrowly ‘won’ that game on xG. In reality, we had actually been humiliated and completely deserved to lose but because we scored a tap in in the final minute as a meaningless consolation it scewed the stats.
We are 25% of the way through the season and absolutely deserve to be in the relegation zone - the evidence of your eyes watching our matches tells you that, no matter what xG might say.
|
|
|
|
Post by macarisredarmy on Nov 1, 2019 8:54:45 GMT
xG stats have to be taken with an absolutely massive pinch of salt. Realised that after that Stoke Analytics account posted the figures after the Preston game which showed we had narrowly ‘won’ that game on xG. In reality, we had actually been humiliated and completely deserved to lose but because we scored a tap in in the final minute as a meaningless consolation it scewed the stats. We are 25% of the way through the season and absolutely deserve to be in the relegation zone - the evidence of your eyes watching our matches tells you that, no matter what xG might say. Of course we deserve to be there. No matter how many 'we are better than our position tells us' trolled out rubbish lines are said from the manager and players - they are still awful. |
|
|
|
Post by tony1234 on Nov 1, 2019 12:24:06 GMT
Its interesting to think why xG fails to explain us and our position....
xG is made up from
Distance from goal – Generally, the closer you are the higher the xG.
Angle of the shot – Generally, the more acute the angle, the lower the xG.
Shooting part – Was it with the strong foot, weak foot or a header?
Passage of play – Was it from open-play or from a set piece?
Chance creation – Did the opportunity come from a cross, a through ball etc?
The shot – Was it from a rebound, did it come after beating an opponent etc?.
Based on what the model puts in (and doesn't put in) a couple of possibilities:-
1. Low quality of our strikers (or confidence)
2. Low quality of goalkeeper (or confidence)
3. It doesn't model "positioning" of defenders or attackers - i.e. was the shot through a crowded area or created with fewer players betwee player and goal
A "hunch"/guess or two:-
i) We struggle to make headway because players don't understand their roles and the system intuitively. The man on the ball has options that are often too few or too difficult to make progress resulting in incoherent moves and a lack of penetration towards the opposition. Consequently, chances we create are not as good as xGa might suggest, because our sluggishness means the opposing defence is more ready than our's to defend a shot from a given distance, angle etc. Or perhaps the chances are not of the type suitable for our strikers' strengths.
ii).... another addition - perhaps more important - is that uncomfortable and confused (and frustrated) players make more mistakes. Its a lack of preparation though, not luck.
ii) A measure of the quality of strikers in finishing moves is "Goals scored/xGa" - so who is the culprit?. I'd imagine, for instance, Gregory saved header at Sheff Wed would have had an xGa of 0.8 or something..... And i'd bet he wouldn't fare so well in other matches either.
We'd probably need to see some examples of Stoke chances that the model had given high xGa to.
Its not luck we are at the bottom though.
|
|
|
|
Post by tachyon on Nov 11, 2019 10:52:14 GMT
Its not luck we are at the bottom though. Luck's a bad choice of words, but that's down to us and variance is even worse. xG's even worse again, but the audience wasn't particularly broad when it was coined. Single game xG is mostly descriptive, it does quantify talking points/misses/goals, but it doesn't carry much signal. xG's most useful when looked at in the longer term and it easily outperforms actual goals allowed or scored as an indicator of a team's underlying ability and how they'll do in the future. The debate is largely over on that topic. Team's who are under or over performing their xG aren't "poor" or "clinical" they are almost always experiencing the randomness that is inherent in any probabilistic process and outcome invariably regresses to process. I had Gregory's header as a 40% chance, 80% is slightly above penalty kick territory. |
|
|
|
Post by tony1234 on Nov 11, 2019 21:06:28 GMT
Its not luck we are at the bottom though. Luck's a bad choice of words, but that's down to us and variance is even worse. xG's even worse again, but the audience wasn't particularly broad when it was coined. Single game xG is mostly descriptive, it does quantify talking points/misses/goals, but it doesn't carry much signal. xG's most useful when looked at in the longer term and it easily outperforms actual goals allowed or scored as an indicator of a team's underlying ability and how they'll do in the future. The debate is largely over on that topic. Team's who are under or over performing their xG aren't "poor" or "clinical" they are almost always experiencing the randomness that is inherent in any probabilistic process and outcome invariably regresses to process. I had Gregory's header as a 40% chance, 80% is slightly above penalty kick territory. Good pts, but am still not entirely sure on this - "Team's who are under or over performing their xG aren't "poor" or "clinical" they are almost always experiencing the randomness that is inherent in any probabilistic process" Im a strong believer in randomness, even very sadly once doing a Monte Carlo sum of league position based on giving every team the same probability-distribution of scoring rates and seeing what the final range was. (There was probably a more elegant way, but i wanted to tweak the parameters). I can't remember the details but sort of remember about an average 30pt gap from top to bottom. So that's the randomness component of the range of final pts in the table. Mostly agree on xG - The analysis i saw had a correlation of xG to future goals scored of 0.59 over half a season (and about 0.1 stronger than using "previous goals" or "shots" as the predictor variable), so think that there is still scope for some other factors before we utimately conclude that its "nearly always" simply randomness. Two of these could be quality of defenders at defending shots and quality of attackers at taking them, but not investigated and so just a hypothesis. I guess the next evoluton of xG with big data will be to assign player-specific values based on their shooting histories in different situations and match contexts. The data largely exists now. - and the bits of analysis seen towards these ends seems to point the intuitively best players in the right part of the matrix. (Given the strong influence of individual player variables shown below, Im therefore minded to think Stoke's predicament was in these areas of low quality players - or players systematically executing more poorly for reasons outside the r=0.59 relationship - in defensive and attacking positions, rather than pure randomness). 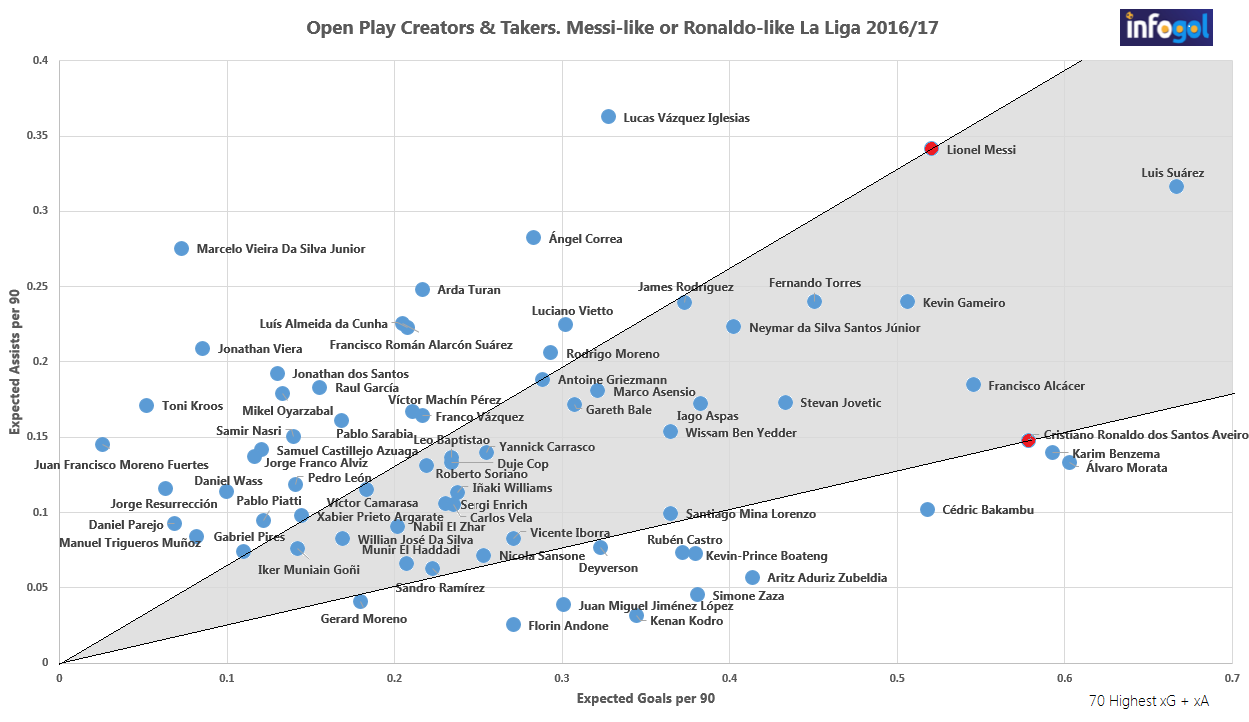 |
|
|
|
Post by tachyon on Nov 12, 2019 9:15:28 GMT
[/quote] Im a strong believer in randomness, even very sadly once doing a Monte Carlo sum of league position based on giving every team the same probability-distribution of scoring rates and seeing what the final range was. (There was probably a more elegant way, but i wanted to tweak the parameters). I can't remember the details but sort of remember about an average 30pt gap from top to bottom. So that's the randomness component of the range of final pts in the table. [/quote] That's a good method. The standard deviation of final points for an "all teams equal" Championship is 9 points, the reality is around 15. For the 20 team Premier League the numbers are 8 & 16 respectively. As to the "clinical vs not clinical", the data persuades me. If you took the 20 most under achieving goal scoring teams (they scored proportionally fewest goals compared to the xG they created) in their first 23 Championship games and then looked at how they did in the final 23 games, you find that, as a group they performed exactly in line with their combined xG in the second half of the season. The under-performance regressed almost completely to their actual xG. Same thing happens with the biggest over performers. The over performance dwindles away and their actual returns match their underlying process in the remainder of the season. Also if you try to predict the second half performance from the first half, using past xG beats using past actual goals in nearly 80% of the cases. Being clinical is largely a myth, as is being Dave Bamber (the latter is cognitive bias anchored on a few high profile memories). Defensively, it's a little more complicated, teams like Burnley do seem to retain a bit of their over performance, but it's not much & opponents adapt & even Dyche can't keep teams above the curve for long. The underlying quality of teams and players to score goals is defined predominately by their ability to create or get onto the end of chances, and not how they convert those chances, as defined by their actual record. That is mostly random noise. The talent to convert chances has a very narrow range, it is very difficult to find differences in finishing ability that precludes the possibility that the regression coefficient isn't zero. The first time I looked at this problem I only found one PL player (Bale and possibly Agero at that stage of his career) whose finishing ability could reasonably be said to be better than the league average and that dwindled once I took out his free kicks. Similarly, Goal keeping xG efficiency, based on how likely they are to save a shot based on the post shot characteristics (shot type, placement, power, deflection etc) bounces around horribly. I use them as descriptive of performance (for "Team of the Week" stuff), but find very little repeatable signal in over or under performance. Bottom line, Stoke are a mid table side. That's where our results are headed, not because we're going to become clinical or opposing keepers more generous to balance Jack's howlers, but because that's where our underlying process has been since Rowett took over and remained so under Jones. If MO'N is to improve Stoke, he'll have to improve the process, either because he's tactically astute or through new signings, the latter agrees with your final "low quality" players point. The so called "new manager bounce" is often nothing more than a side who have been under performing their underlying stats, then regressing towards their process after the old boss has been fired. The new man often changes little, but reaps the reward of this regression. We don't have extensive xG for internationals, (we have to make do with actual goals), but MO'N certainly improved NI as a defensive unit and mildly improved the attacking output. But it was virtually impossible not to improve the defensive numbers, they were so bad when he took over (see below) Attachment DeletedWhen he took over NI they were shipping nearly 3 goals per game & scoring 0.5 gpg. He's turned that around to a side that scores and concedes around 1.2 gpg. So he's got a different problem to solve at Stoke because that's the point we are already at. I'll be looking for the xG created & xG allowed to start getting some decent separation, rather than a not unexpected win at the worst team in the Championship, (laced with a bit of good fortune). I love the La Liga graphic. The best players do have the best xG & xA (expected assists) per 90 figures, but that is partly team driven. Messi & Ronaldo played for the two best sides, so they had high quality teammates. The idea behind the plot was as a scouting device to find Messi like or Ronaldo like players among the less Spanish teams by drawing a line through their data point to the origin and seeing which players were close to each line. There's nothing implied about their ability to over or under perform xG. You do know the graphic is from my Twitter feed? :-) Good points raised, we're always trying to make xG accessible and intelligent, thoughtful contributions like this help immensely. It's very difficult to interact with the "xG is rubbish" brigade and non evidential nonsense pioneered by the likes of Jeff Stelling. cheers! |
|
|
|
Post by tony1234 on Nov 12, 2019 19:39:46 GMT
Im a strong believer in randomness, even very sadly once doing a Monte Carlo sum of league position based on giving every team the same probability-distribution of scoring rates and seeing what the final range was. (There was probably a more elegant way, but i wanted to tweak the parameters). I can't remember the details but sort of remember about an average 30pt gap from top to bottom. So that's the randomness component of the range of final pts in the table. [/quote] That's a good method. The standard deviation of final points for an "all teams equal" Championship is 9 points, the reality is around 15. For the 20 team Premier League the numbers are 8 & 16 respectively. As to the "clinical vs not clinical", the data persuades me. If you took the 20 most under achieving goal scoring teams (they scored proportionally fewest goals compared to the xG they created) in their first 23 Championship games and then looked at how they did in the final 23 games, you find that, as a group they performed exactly in line with their combined xG in the second half of the season. The under-performance regressed almost completely to their actual xG. Same thing happens with the biggest over performers. The over performance dwindles away and their actual returns match their underlying process in the remainder of the season. Also if you try to predict the second half performance from the first half, using past xG beats using past actual goals in nearly 80% of the cases. Being clinical is largely a myth, as is being Dave Bamber (the latter is cognitive bias anchored on a few high profile memories). Defensively, it's a little more complicated, teams like Burnley do seem to retain a bit of their over performance, but it's not much & opponents adapt & even Dyche can't keep teams above the curve for long. The underlying quality of teams and players to score goals is defined predominately by their ability to create or get onto the end of chances, and not how they convert those chances, as defined by their actual record. That is mostly random noise. The talent to convert chances has a very narrow range, it is very difficult to find differences in finishing ability that precludes the possibility that the regression coefficient isn't zero. The first time I looked at this problem I only found one PL player (Bale and possibly Agero at that stage of his career) whose finishing ability could reasonably be said to be better than the league average and that dwindled once I took out his free kicks. Similarly, Goal keeping xG efficiency, based on how likely they are to save a shot based on the post shot characteristics (shot type, placement, power, deflection etc) bounces around horribly. I use them as descriptive of performance (for "Team of the Week" stuff), but find very little repeatable signal in over or under performance. Bottom line, Stoke are a mid table side. That's where our results are headed, not because we're going to become clinical or opposing keepers more generous to balance Jack's howlers, but because that's where our underlying process has been since Rowett took over and remained so under Jones. If MO'N is to improve Stoke, he'll have to improve the process, either because he's tactically astute or through new signings, the latter agrees with your final "low quality" players point. The so called "new manager bounce" is often nothing more than a side who have been under performing their underlying stats, then regressing towards their process after the old boss has been fired. The new man often changes little, but reaps the reward of this regression. We don't have extensive xG for internationals, (we have to make do with actual goals), but MO'N certainly improved NI as a defensive unit and mildly improved the attacking output. But it was virtually impossible not to improve the defensive numbers, they were so bad when he took over (see below) When he took over NI they were shipping nearly 3 goals per game & scoring 0.5 gpg. He's turned that around to a side that scores and concedes around 1.2 gpg. So he's got a different problem to solve at Stoke because that's the point we are already at. I'll be looking for the xG created & xG allowed to start getting some decent separation, rather than a not unexpected win at the worst team in the Championship, (laced with a bit of good fortune). I love the La Liga graphic. The best players do have the best xG & xA (expected assists) per 90 figures, but that is partly team driven. Messi & Ronaldo played for the two best sides, so they had high quality teammates. The idea behind the plot was as a scouting device to find Messi like or Ronaldo like players among the less Spanish teams by drawing a line through their data point to the origin and seeing which players were close to each line. There's nothing implied about their ability to over or under perform xG. You do know the graphic is from my Twitter feed? :-) Good points raised, we're always trying to make xG accessible and intelligent, thoughtful contributions like this help immensely. It's very difficult to interact with the "xG is rubbish" brigade and non evidential nonsense pioneered by the likes of Jeff Stelling. cheers! [/quote] Really great, interesting post, I very much enjoyed that - you've clearly got a lot of great insight on this stuff. Thanks for taking the time and sharing it!! |
|
|
|
Post by heworksardtho on Nov 12, 2019 19:52:07 GMT
Im a strong believer in randomness, even very sadly once doing a Monte Carlo sum of league position based on giving every team the same probability-distribution of scoring rates and seeing what the final range was. (There was probably a more elegant way, but i wanted to tweak the parameters). I can't remember the details but sort of remember about an average 30pt gap from top to bottom. So that's the randomness component of the range of final pts in the table. [/quote] That's a good method. The standard deviation of final points for an "all teams equal" Championship is 9 points, the reality is around 15. For the 20 team Premier League the numbers are 8 & 16 respectively. As to the "clinical vs not clinical", the data persuades me. If you took the 20 most under achieving goal scoring teams (they scored proportionally fewest goals compared to the xG they created) in their first 23 Championship games and then looked at how they did in the final 23 games, you find that, as a group they performed exactly in line with their combined xG in the second half of the season. The under-performance regressed almost completely to their actual xG. Same thing happens with the biggest over performers. The over performance dwindles away and their actual returns match their underlying process in the remainder of the season. Also if you try to predict the second half performance from the first half, using past xG beats using past actual goals in nearly 80% of the cases. Being clinical is largely a myth, as is being Dave Bamber (the latter is cognitive bias anchored on a few high profile memories). Defensively, it's a little more complicated, teams like Burnley do seem to retain a bit of their over performance, but it's not much & opponents adapt & even Dyche can't keep teams above the curve for long. The underlying quality of teams and players to score goals is defined predominately by their ability to create or get onto the end of chances, and not how they convert those chances, as defined by their actual record. That is mostly random noise. The talent to convert chances has a very narrow range, it is very difficult to find differences in finishing ability that precludes the possibility that the regression coefficient isn't zero. The first time I looked at this problem I only found one PL player (Bale and possibly Agero at that stage of his career) whose finishing ability could reasonably be said to be better than the league average and that dwindled once I took out his free kicks. Similarly, Goal keeping xG efficiency, based on how likely they are to save a shot based on the post shot characteristics (shot type, placement, power, deflection etc) bounces around horribly. I use them as descriptive of performance (for "Team of the Week" stuff), but find very little repeatable signal in over or under performance. Bottom line, Stoke are a mid table side. That's where our results are headed, not because we're going to become clinical or opposing keepers more generous to balance Jack's howlers, but because that's where our underlying process has been since Rowett took over and remained so under Jones. If MO'N is to improve Stoke, he'll have to improve the process, either because he's tactically astute or through new signings, the latter agrees with your final "low quality" players point. The so called "new manager bounce" is often nothing more than a side who have been under performing their underlying stats, then regressing towards their process after the old boss has been fired. The new man often changes little, but reaps the reward of this regression. We don't have extensive xG for internationals, (we have to make do with actual goals), but MO'N certainly improved NI as a defensive unit and mildly improved the attacking output. But it was virtually impossible not to improve the defensive numbers, they were so bad when he took over (see below) Attachment DeletedWhen he took over NI they were shipping nearly 3 goals per game & scoring 0.5 gpg. He's turned that around to a side that scores and concedes around 1.2 gpg. So he's got a different problem to solve at Stoke because that's the point we are already at. I'll be looking for the xG created & xG allowed to start getting some decent separation, rather than a not unexpected win at the worst team in the Championship, (laced with a bit of good fortune). I love the La Liga graphic. The best players do have the best xG & xA (expected assists) per 90 figures, but that is partly team driven. Messi & Ronaldo played for the two best sides, so they had high quality teammates. The idea behind the plot was as a scouting device to find Messi like or Ronaldo like players among the less Spanish teams by drawing a line through their data point to the origin and seeing which players were close to each line. There's nothing implied about their ability to over or under perform xG. You do know the graphic is from my Twitter feed? :-) Good points raised, we're always trying to make xG accessible and intelligent, thoughtful contributions like this help immensely. It's very difficult to interact with the "xG is rubbish" brigade and non evidential nonsense pioneered by the likes of Jeff Stelling. cheers! [/quote] You need a wife , girlfriend or both 😎 |
|
|
|
Post by TheProletarian on Nov 12, 2019 20:41:49 GMT
I’m so sick of hearing the words ‘false position’, I think they should be banned. If we’re in the relegation zone come May, do you reckon they’ll keep us around because we’re in a “false position”? It’s just a way for shite managers to justify their shite performances and glorify their own work at the club.
|
|
|
|
Post by TheProletarian on Nov 12, 2019 20:43:17 GMT
Sick of hearing Expected Goals too. I’m “expecting” £20,000 tomorrow morning, doesn’t mean it’ll show up at my doorstep as I wake up.
|
|
|
|
Post by tachyon on Nov 12, 2019 21:11:58 GMT
[/quote] You need a wife , girlfriend or both 😎[/quote] You need to work out how to edit a reply  |
|
|
|
Post by RedandWhite90 on Nov 12, 2019 21:26:38 GMT
Sick of hearing Expected Goals too. I’m “expecting” £20,000 tomorrow morning, doesn’t mean it’ll show up at my doorstep as I wake up. It is slightly different but I get your point. |
|
|
|
Post by tachyon on Nov 13, 2019 7:43:21 GMT
[/quote] Really great, interesting post, I very much enjoyed that - you've clearly got a lot of great insight on this stuff. Thanks for taking the time and sharing it!! [/quote] thanks, Tony I came up with the idea of xG independently of a couple of other analysts in 2010. I called the metric "goal expectation". Around 2013 the analytics community had a vote to standardise terminology and xG won. I voted for chance quality. I've worked providing xG models & implimenting them in real life scenarios across a variety of industries since then. I know xG inside out, the pitfalls, the benefits. Inside football I know which teams are using xG, the people making the decisions and the deals that have used xG to inform. No one knows more about xG than I do and I'm happy to share what I can  |
|
|
|
Post by starkiller on Nov 13, 2019 15:18:50 GMT
I’m so sick of hearing the words ‘false position’, I think they should be banned. If we’re in the relegation zone come May, do you reckon they’ll keep us around because we’re in a “false position”? It’s just a way for shite managers to justify their shite performances and glorify their own work at the club. We had a false manager. |
|